Entrepreneurial activity always sets itself the main task of making a profit. Otherwise it doesn't make sense.
One of the main factors influencing profit is conducting an effective, correct and timely financial and economic condition of the enterprise and the efficiency of using its resources.
Key business performance indicators
When conducting a financial and economic analysis of any enterprise, it is necessary, initially, to calculate a number of standard indicators.
These include:
- profitability certain business activities under certain conditions;
- payback period invested capital;
- break even or the threshold of profitability of the financial and economic activities of the organization;
Profitability threshold
Determining the profitability threshold is very important for further efficient work organizations. The profitability threshold indicator shows how much of a product needs to be produced and sold and how many services to provide in order for all costs to be covered.
That is, this is the volume of goods or services at which profits (losses) are equal to zero.
Why is this indicator needed, what does it measure?
The profitability threshold indicator must be calculated from various points of view:
- this indicator characterizes the state of the organization when it does not make a profit, but still remains afloat;
- Knowing this indicator, you can determine, having crossed which barrier the enterprise will bring more and more profit or fall into a loss;
Formula for calculating the profitability threshold
The profitability threshold of any organization can be calculated in two ways:
- In monetary terms
Pr= (Revenue*Fixed costs) / (Revenue – variable costs)
- In kind
Pr = Fixed costs / (cost of a unit of goods (services) - average variable costs per unit of goods (services))
Determining the profitability threshold graphically
You can also determine the profitability threshold indicator and analyze the results obtained graphically. This method makes it possible to clearly see in which situations business efficiency increases and in which situations it decreases.
To build a graph you need the following::
- It is necessary to calculate the profitability threshold indicator for several sales volumes and mark all points on the charts;
- You need to draw a straight line through the obtained points or a curve connecting them;
An example of plotting a graph can be viewed at http://finzz.ru/porog-rent-formula-primer
Calculation of the profitability threshold in Excel
It is convenient to calculate such an indicator as profitability threshold in Excel.
To do this you need to do the following:
- write different volumes of production or sales in one column;
- in the other column are fixed costs corresponding to each volume;
- in the third column are variable costs corresponding to each volume;
- you need to enter the cost of one unit of product or service in a separate cell;
- the last column contains the formula for calculating the profitability threshold;
The main profitability indicators are:
- Performance indicator of production assets;
- Indicator of profitability of goods and services;
- The effectiveness of financial investments in the main business activities of the organization;
Sensitivity and Profitability Analysis
When calculating the profitability threshold, it is important to assess the impact of changing the initial parameters on the final result. This analysis is called sensitivity and profitability analysis.
The final result is based on the organization’s profit margin and NVP indicator.
Financial indicators
No less important is the definition and other financial indicators among which are:
- break-even point (profitability threshold in monetary terms, often shown graphically);
- financial strength;
- operating leverage;
Break even
The break-even point shows clearly, that is, graphically, at what volume of products sold (services provided) the enterprise will not make a profit, but will not make a loss either.
In fact, the break-even point is synonymous with the profitability threshold.
Break-even point formula
You can use the following calculations:
Break-even point = (Revenue*Fixed costs) / (Revenue – variable costs)
Break-even chart
The break-even chart is constructed similarly to the graphical representation of the profitability threshold.
Financial strength margin
The calculation of the break-even point leads to the determination of two more important indicators for the analysis of the financial and economic activities of the organization. One of them is financial safety margin.
It shows the percentage of actual production volume and sales to volume at the point at which profit(loss) is zero.
The higher the percentage obtained from this ratio, the stronger the enterprise is considered.
Operating leverage
Another indicator resulting from determining the break-even point is called operating leverage. It is characterized by determining the reaction of changes in profit depending on changes in income.
Formulas
Operating leverage (price) = revenue from all sales for a certain period / profit received from all sales for the same period
Operating leverage (natural) = (revenue - variable costs) / profit
Net present value method
NPV or net present value method means evaluating a business activity in terms of discounted cash flow.
To carry out such an analysis it is necessary to find the sum of incoming and outgoing cash flows related to a specific investment project.
NPV calculation formula
NPV = ∑ (NCFi)/(1+r) – Inv, Where
NCFi - stream financial resources for the i-th period
r — discount rate
Inv – financial initial investment
Discounting calculation
Discounting means finding the value of financial flows that an enterprise should receive in the future. 
To do this, you need to know the following assumed values:
- revenue;
- investments;
- expenses;
- discount rate;
- residual value of the organization's property;
Discount rate
The discount rate is determined by the rate of return on financial investments required by investors.
Project payback period
Another important indicator for investors when determining the effectiveness of an investment project is its payback period. This indicator shows how much time needs to be spent in order for income to cover all expenses together with investments.
Discounted payback period
The most applicable indicator for determining the payback of a project is the discounted payback indicator. This indicator determines exactly the time during which it is possible to return the money invested in the “business” at the expense of net financial flow, taking into account the discount rate.
Internal rate of return
When the net present value is zero, the interest rate is called the internal rate of return. This is another indicator characterizing the profitability of investment projects of the organization.
Coverage ratio
By determining the ratio of current assets to short-term liabilities, you can calculate the indicator that determines the coverage ratio.
It shows the organization’s ability to pay current financial obligations to other business entities from working capital.
Summary
To conduct an effective financial and economic analysis, it is necessary to calculate the following indicators:
- enterprise profitability threshold at different production volumes;
- calculate the break-even point;
- company resilience will show an indicator of financial strength and operating leverage;
- to determine effectiveness any investment projects must initially calculate the discount rate, internal rate of return, and discounted payback period;
- for a more visual analysis the profitability threshold should be calculated in Excel or displayed graphically;
The main indicator of the effectiveness of any type of business activity is profit, which can be predicted after calculating the profitability threshold.
The profitability threshold is a relative indicator of the volume of revenue from product sales, which covers all existing expenses without making a profit and without incurring losses. That is, financial activity is zero, with the integrated use of labor, monetary, and material resources. In most cases it is expressed using percentages, as well as per unit of funds invested in profit.
Dear reader! Our articles talk about typical ways to resolve legal issues, but each case is unique.
If you want to know how to solve exactly your problem - contact the online consultant form on the right or call by phone.
It's fast and free!

How to calculate
In order to plan further profit and financial position, it is necessary to calculate the profitability threshold, which all companies strive to exceed. There are several calculation formulas that are expressed in monetary and in kind terms, namely:
- Profitability formula in monetary terms: PR d = V * Z post / (V – Z lane). Where, PR d– profitability threshold, V– revenue, Z post– costs are constant, determined by the volume of products produced, namely transportation costs, purchase of raw materials and supplies, Z lane– Variable costs include rent, depreciation, utilities and wages.
- Profitability formula in physical terms: PR n = Z post / (C – ZS per). Where, PR n– profitability threshold in pieces, C– product price, ZS lane– average variable costs.
An example of calculating the profitability threshold based on a certain enterprise “X”, which sells 112 units, should be given. finished products, the price per piece is 500 rubles. Variable costs for the production of one unit are equal to 360 rubles. Fixed costs per unit are 80 rubles, and constant indirect costs are 36 rubles.
In order to proceed to the formula, it is necessary to determine the total number of variable and fixed costs.
They are calculated as follows:
Z post = (80 + 36) * 112 = 12992 rub.
Z lane = 360 * 112 = 40320 rub.
V = 112 * 500 = 56,000 rub.
PR d = 56000 * 12992/ (56000 – 40320),
PR d = 727552000/15680,
PR d = 46,400 rub.
The resulting amount of the profitability threshold indicates that the enterprise, after selling its products, will begin to make a profit if it exceeds 46,400 rubles.
PR n = 12992 / (500 – 360),
PR n = 12992 / 140,
PR n = 92.8 pcs., after rounding it is 93 pcs.
The data obtained indicate that the company will begin to make a profit when sales volume exceeds 93 units.
Profitability threshold and financial safety margin
Determining the profitability threshold allows you to plan future investments, for example, minimize costs in the event of a lack of demand, increase production volume, operate sustainably and create a certain financial reserve. And also constantly monitor the indicators of your position in the market and develop rapidly.
The margin of financial strength makes it possible to reduce the volume of production, provided that no losses are observed.
It can be determined by subtracting the profitability threshold indicator from the amount of revenue. The higher this indicator is, the more financially stable the enterprise will be. If revenue decreases below the profitability threshold, there will be a shortage of liquid funds and the company's financial position will deteriorate significantly.
Based on the indicator of the profitability threshold of enterprise “X”, it is possible to determine the margin of financial strength:
FFP = V-PR d,
ZPF = 56000 – 46400,
ZPF = 9600 rub.
It follows from this that the enterprise, without serious losses, can withstand a decrease in revenue by 9,600 rubles.
These two indicators are important not only for enterprises, but also for lenders, because on their basis a company can obtain the necessary loan.
Profitability threshold
Profitability in its essence is the profitability or profitability that an enterprise receives as a result of its work.
The main profitability indicators include:
- Enterprise profitability or balance sheet, is an indicator that shows the efficiency of an enterprise or industry as a whole.
- Product profitability, is determined by the ratio of profit from sales to the cost of production or to total costs, and characterizes the result of current costs. It is calculated for all types of products, which allows you to evaluate production activities. Today, economists around the world determine the financial condition of enterprises using the profitability ratio, which shows the effectiveness of probable or planned investments.
- Return on sales is an indicator or coefficient of the share of profit in each earned monetary unit, and is also a certain indicator that affects pricing policy. It is determined based on the ratio of profit to revenue from the sale of all products.
Profitability Threshold Analysis
The profitability threshold fully characterizes the operation of the enterprise rather than profit. It shows the overall ratio of resources used and those available. Its calculation is used both to evaluate the company’s activities and for future investments and pricing policy.
It should be noted that the profitability indicators of the enterprise, products and sales are calculated based on data from net profit, revenue from product sales, as well as balance sheet profit.
How to lower the profitability threshold
The only way to reduce the profitability threshold is to increase the gross margin, that is, marginal income, which is equal to fixed costs during the critical sales volume.
In this case it is necessary:
- Increase the volume of product sales.
- Increase the price of products, but within the limits of effective demand.
- Reduce variable costs, namely wages, rent or utility bills.
- Reduce fixed costs, which increase the threshold of profitability and reflect the degree of risk of business activity.
In order for an enterprise to operate and develop, it is necessary to competently combine low fixed costs with high gross margins. In this case, it is possible to calculate the profitability threshold by dividing fixed costs by the gross margin ratio.
Profitability is an indicator of effectiveness in the use of labor, economic, material and natural resources.
Profitability threshold- this is the totality of products sold, thanks to which the company covers its production costs without making a profit from sales, that is, it goes to “zero”.
If we talk about trading companies, then profitability is expressed by specific numerical characteristics, that is, by correlating profits and capital investments. A business is profitable if at the end of the year the enterprise is in the black.
Dear reader! Our articles talk about typical ways to resolve legal issues, but each case is unique.
If you want to know how to solve exactly your problem - contact the online consultant form on the right or call by phone.

It's fast and free!
The profitability ratio is the ratio of profit to resources (material assets, flows, etc.) that form this profit.
Most often, profitability is determined as a percentage. But in some cases it can be presented in the form of profit per unit of invested assets, or in profit from each earned financial unit.
Depending on the type of business activity, profitability is classified as follows:
- Overall return on tangible assets. It is formed by the ratio of profit (before taxes) to the totality of material assets attracted to the company for a fixed period of time.
- Product profitability. It is determined as the result of dividing the profit from sales of a product by the costs of its production.
- Profitability of production. Production is considered profitable when the profit from investments exceeds the costs of producing goods. Among the methods that influence the growth of profitability are reducing the cost of manufactured products and improving quality properties.
General form mathematical expression of profitability:
P=P/I*100%, where:
- R– profitability;
- P– profit received during the implementation of the project;
- AND– investment in the project.
Determining the profitability threshold
It is determined by the formula:
- Profitability threshold = Fixed costs / ((Sales revenue – Variable costs) / Sales revenue).

When the profitability threshold is reached, the company has neither profit nor loss.
The break-even point is of great importance for investors, as it reflects the ability to repay the debt on the loan provided. The reliability of an enterprise is determined by the excess of the sales level over the profitability threshold.
The degree of distance between the enterprise's profitability value and the break-even point is determined by the margin of financial strength.
To obtain the value of the financial safety margin, it is necessary to find the difference between the actual number of goods produced and the number of goods produced at the break-even point.
Calculation formulas
By calculating the break-even point, we obtain the maximum amount of income from product sales. Selling goods at a reduced price makes the business unprofitable.
Thus, the company will make a profit only when the income rises above the profitability limit.
In monetary terms
Prd = VxZpost/(V – Zperem), where:
- Prd- break-even point in value terms;
- IN
- Let's lock it up- variable costs;
- Zpost- fixed costs.
In kind
Prn = Zpost/(B - ZSperem), where
- Prn– profitability threshold, value in units of goods;
- Zpost- the value of fixed costs;
- Let's move on– average value of variable costs (per 1 product);
- IN- general level of income (revenue);
Examples
Example of calculation in monetary terms:
- The company sells 200 pcs. goods priced at 300 rubles/1 piece.
- Variable costs in the unit cost of goods are equal to 250 rubles.
- Direct costs in the cost of a unit of goods - 30 rubles.
- Indirect direct costs in the cost of a unit of goods - 20 rubles.
It is required to determine the break-even point of the enterprise.
We calculate the profitability threshold in value terms:
- Zpost= (30+20)x200 = 10,000 rub.
- Let's lock it up= 250 x 200 = 50,000 rub.
- IN= 200x300 = 60,000 rub.
- Prd= 60000x10000/(60000-50000) = 60000 rub.
The resulting break-even point reflects that the company will make a profit after selling goods worth more than 60,000 rubles.
Example of calculation in physical terms:
Prn(Profitability threshold in units of goods) = 10000/(300-250) = 200.
For an example of calculation, let's take the same input data.
Thus, the company will make a profit after selling 200 units of goods.
Basic indicators
In order to analyze the financial condition of the company, the following criteria for assessing profitability are used:
- Economic profitability ratio. The return on tangible assets ratio reflects the amount of profit received from all assets that the company has. A decrease in the profitability of monetary assets is characterized by a decrease in demand for the company's products.
- Financial profitability ratio. The return on equity ratio reflects the degree of profitability of a company's capital. In this regard, this indicator is very interesting for a certain circle of people, namely, shareholders and the owner of the enterprise.
- Activity profitability ratio. This indicator is determined by the ratio of the company's net profit to net sales revenue. An increase in this indicator indicates an increase in the company’s performance, while a decrease, on the contrary, indicates its unproductive activity.
- Economic profitability- this is one of the most important criteria for the attractiveness of a company, because the level of profitability reflects the upper threshold of interest payments.
Factors Affecting Profitability
External
High efficiency of company management cannot reduce the level of influence of external factors on business profitability.
This type of factors includes:
- territorial location of the company (distance from sales centers, raw material deposits, etc.);
- competitiveness of the product and demand for it;
- changes in market conditions;
- the influence of the state on the economy (market regulation at the legislative level, adjustment of the refinancing rate, changes in tax laws, etc.);
Production
- means of production;
- labor resources;
The influence of these factors on the functioning of the company can be characterized from two sides:
- extensive influence (determined by changes in the numerical parameters of the production process) includes:
- changes in time and quantitative indicators of the production process;
- change in means of production (related to fixed assets: equipment, buildings, etc.) and their quantity (for example, an increase in the amount of inventories);
- change in the number of jobs, changes in work schedules, downtime;
- intensive influence is associated with increased efficiency in the use of production factors;
It includes:
- maintaining equipment in the best condition, and its timely replacement with technologically more advanced ones;
- use of modern materials, improvement of production technology;
- increasing the level of personnel qualifications, reducing the level of labor intensity of products, proper organization of the labor process.
Break even corresponds to the sales volume at which the company covers all fixed and variable costs without making a profit. Any change in revenue at this point results in a profit or loss. In practice, two methods are used to calculate a given point: graphical and equational.
With the graphical method Finding the break-even point comes down to constructing a comprehensive graph “costs – production volume – profit”.
The break-even point on the graph is the point of intersection of straight lines built according to the value of total costs and gross revenue. At the break-even point, the revenue received by the enterprise is equal to its total costs, while the profit is zero. The amount of profit or loss is shaded. If a company sells products less than the threshold sales volume, then it suffers losses; if it sells more, it makes a profit.
Revenue corresponding to the break-even point is called threshold revenue . The volume of production (sales) at the break-even point is called threshold production volume (sales), if an enterprise sells products less than the threshold sales volume, then it suffers losses, if more, it makes a profit.
Equation method based on the use of a formula for calculating the break-even point
Qpcs = Fixed costs / (Price per unit of production - Variable costs per unit of production)
y =a + bx
a– fixed costs, b– variable costs per unit of production, x– the volume of production or sales at a critical point.
Profitability threshold- this is such sales revenue at which the company has no losses, but has not yet made a profit. In such a situation, sales revenue after recovering variable costs is sufficient to recover fixed costs.
Profitability Threshold = Fixed Costs / Contribution Margin Ratio
Coeff. contribution margin = (sales volume – variable costs) / sales volume
It is desirable that marginal income not only covers fixed costs, but also serves as a source of operating profit.
Financial strength margin – the excess of actual sales revenue over the profitability threshold:
Margin of financial strength = ((Planned sales revenue – Threshold sales revenue) / Planned sales revenue) ´ 100%
The strength of operating leverage shows how many times profit will change if sales revenue changes by one percent.
Break-even point (profitability threshold)– this is such revenue (or quantity of products) that ensures full coverage of all variable and semi-fixed costs with zero profit. Any change in revenue at this point results in a profit or loss.
Profitability threshold can be determined both graphically and analytically: Revenue = Variable costs + Fixed costs + Profit
Using the graphical method, the break-even point (profitability threshold) is found as follows:
1. find the value of fixed costs on the Y axis and plot the line of fixed costs on the graph, for which we draw a straight line parallel to the X axis;
2. select a point on the X axis, i.e. any value of sales volume, we calculate the value of total costs (fixed and variable) for this volume. We construct a straight line on the graph corresponding to this value;
3. We again select any value of sales volume on the X-axis and for it we find the amount of sales revenue. We construct a straight line corresponding to this value.
Break even on the graph - this is the point of intersection of straight lines built according to the value of total costs and gross revenue (Fig. 1). At the break-even point, the revenue received by the enterprise is equal to its total costs, while the profit is zero. The amount of profit or loss is shaded. If a company sells products less than the threshold sales volume, then it suffers losses; if it sells more, it makes a profit.

Figure 1. Graphic determination of the break-even point (profitability threshold)
Profitability threshold = Fixed costs/Gross margin ratio
Gross margin ratio. Gross margin (the amount to cover fixed costs and generate profit) is defined as the difference between revenue and variable costs.
Gross Margin Ratio = Gross Margin / Sales Revenue
Factor of production cost of goods sold = Cost of products sold / Sales revenue
General and administrative expense ratio = Amount of general and administrative costs / Sales revenue
You can calculate the profitability threshold for both the entire enterprise and individual types of products or services.
A company begins to make a profit when actual revenue exceeds a threshold. The greater this excess, the greater the margin of financial strength of the enterprise and the greater the amount of profit.
Financial strength margin. The excess of actual sales revenue over the profitability threshold.
Financial strength margin= enterprise revenue - profitability threshold.
The strength of the impact of operating leverage (shows how many times profit will change if sales revenue changes by one percent and is defined as the ratio of gross margin to profit).
1. Gross margin = sales revenue - variable production costs.
2. Gross margin ratio = gross margin / sales revenue.
3. Profitability threshold (break-even point) = sum of fixed costs / gross margin ratio.
4. Margin of financial strength:
a) in rubles = sales revenue - profitability threshold;
b) as a percentage of sales revenue = profitability threshold in rubles / sales revenue.
5. Profit = margin of financial strength ´ gross margin ratio.
6. Operating leverage = gross margin/profit.
The main purpose of operational analysis is to find the most favorable relationship between variable costs per unit of production and fixed costs.
1. Gross Margin. One of the main tasks of financial management is to maximize the gross margin, since it is the source of covering fixed costs and determines the amount of profit.
2. Gross Margin Ratio. In operational analysis, it is used only to determine the forecast profit level.
3. Profitability threshold (break-even point)- a situation in which the subsidiary does not incur losses, but also has no profit. At the same time, the number of sales below the break-even point entail losses, while sales above the break-even point bring profit. The higher the profitability threshold, the more difficult it is for an enterprise to cross it. S/p with a low profitability threshold are more easily able to cope with a drop in demand for products and, as a result, a decrease in selling prices.
4. Financial strength margin shows the excess of actual sales revenue over the profitability threshold. The larger this value, the more financially stable the p/p is.
5. This technique is used only for forecast calculations (short-term and medium-term forecasts).
Profitability threshold(break-even point, critical point, critical volume of production (sales)) is the volume of sales of a company at which sales revenue fully covers all costs of production and sales of products. To determine this point, regardless of the methodology used, it is first necessary to divide the projected costs by constants and variables.
The practical benefit of the proposed division of costs into fixed and variable (the value of mixed costs can be neglected or proportionally attributed to fixed and variable costs) is as follows:
Firstly, it is possible to determine exactly the conditions for a firm to cease production (if the firm does not recoup average variable costs, then it must stop producing).
Secondly, it is possible to solve the problem of maximizing profit and rationalizing its dynamics for the given parameters of the company due to the relative reduction of certain costs.
Third, such a division of costs makes it possible to determine the minimum volume of production and sales of products at which break-even of the business is achieved (profitability threshold), and to show how much the actual production volume exceeds this indicator (the company's margin of financial strength).
Profitability threshold is defined as revenue from sales in which the enterprise no longer has losses, but does not receive profits, that is, financial resources from sales after reimbursement of variable costs are only sufficient to cover fixed costs and profit is zero.
Break-even point in physical terms for the production and sale of a specific product (TB) is determined by the ratio of all fixed costs for the production and sale of a specific product (Zpost) to the difference between the price (revenue) (P) and variable costs per unit of product (Zud. per.):
Break-even point in value terms is defined as the product of the critical volume of production in physical terms and the price of a unit of production.
Calculation of the profitability threshold is widely used in planning profits and determining the financial condition of an enterprise. Two rules useful for an entrepreneur:
1. It is necessary to strive for a position where revenue exceeds the profitability threshold, and produce goods in kind in excess of their threshold value. At the same time, the company's profits will increase.
2. It should be remembered that the closer production is to the profitability threshold, the greater the influence of the production lever, and vice versa. This means that there is a certain limit of exceeding the profitability threshold, which must inevitably be followed by a jump in fixed costs (new means of labor, new premises, increased costs of enterprise management).
The company must necessarily pass the threshold of profitability and take into account that after the period of increasing the mass of profit, a period will inevitably come when, in order to continue production (increase in output), it will simply be necessary to sharply increase fixed costs, which will inevitably result in a reduction in profits received in the short term.
When making a specific decision on the volume of production, an entrepreneur should take these conclusions into account.
Financial strength margin shows how much sales (production) of products can be reduced without incurring losses. The excess of real production over the profitability threshold is a margin of financial strength of the company:
Financial strength margin= Revenue – Profitability threshold
The margin of financial strength of an enterprise is the most important indicator of the degree of financial stability. The calculation of this indicator allows us to assess the possibility of an additional reduction in revenue from product sales within the break-even point.
In practice, three situations are possible that will have different effects on the amount of profit and the margin of financial strength of the enterprise: 1) the volume of sales coincides with the volume of production; 2) sales volume is less than production volume; 3) sales volume is greater than production volume.
Both the profit and the margin of financial strength obtained with an excess of produced products are less than when sales volumes correspond to production volumes. Therefore, an enterprise interested in increasing both its financial stability and financial result, should strengthen control over production volume planning. In most cases, an increase in a company's inventory indicates an excess of production. Its excess is directly evidenced by an increase in inventories in terms of finished products, and indirectly by an increase in inventories of raw materials and starting materials, since the company incurs costs for them already when purchasing them. A sharp increase in inventories may indicate an increase in production in the near future, which must also be subject to rigorous economic justification.
Thus, if an increase in an enterprise’s reserves is detected in the reporting period, one can draw a conclusion about its impact on the value of the financial result and the level of financial stability. Therefore, in order to reliably measure the amount of the financial safety margin, it is necessary to adjust the sales revenue indicator by the amount of the increase in the enterprise's inventory for the reporting period.
In the last version of the relationship - with a sales volume greater than the volume of manufactured products - the profit and margin of financial strength are greater than with the standard construction. However, the fact of selling products that have not yet been produced, that is, does not actually exist at the moment (for example, when prepaying a large batch of goods that cannot be produced for the current reporting period), imposes additional obligations on the enterprise that must be fulfilled in future. There is an internal factor that reduces the actual value of the financial safety margin - this is hidden financial instability. A sign that an enterprise has hidden financial instability is a sharp change in the volume of inventories.
So, to measure the margin of financial safety enterprises need to perform the following steps:
1) calculation of the financial safety margin;
2) analysis of the impact of the difference between sales volume and production volume through correction of the financial safety margin, taking into account the increase in the enterprise’s inventory;
3) calculation of the optimal increase in sales volume and the limiter of the financial safety margin.
The margin of financial strength, calculated and adjusted, is an important comprehensive indicator of the financial stability of the enterprise, which must be used when forecasting and ensuring the comprehensive financial stability of the enterprise.
Let's consider the enterprise profitability threshold, the calculation formula and its connection with the break-even point and the margin of financial strength.
Profitability threshold(analog.BEPbreakevenpoint, break-even point, critical point, profitability threshold)- this is the sales volume of the enterprise at which the minimum level of profit is achieved (equal to zero). In other words, the enterprise operates on self-sufficiency of its costs. The threshold for the profitability of an enterprise is sometimes called in practice.
Purpose of assessing the profitability threshold in the definition is minimal permissible level volume of production and sales, on the basis of which the margin of financial strength necessary to maintain the sustainable functioning of the enterprise is calculated. The profitability threshold is assessed both by the owners of the enterprise when planning future production and sales volumes, as well as by creditors and investors when assessing the financial condition.
When calculating the profitability threshold, two types of costs are used:
- Fixed costs (English)V.A.VariableCosts)- a type of enterprise costs, the size of which does not depend on changes in the volume of production and sales of products.
- Variable costs (English)F.C.FixedCosts)- a type of enterprise costs, the size of which directly depends on the volume of production and sales of products.
Fixed costs will include expenses for personnel wages, rental of production and other premises, deductions for the unified social tax and property tax, marketing costs, etc.
Variable costs consist of expenses for raw materials, supplies, components, fuel, electricity, bonuses for staff salaries, etc.
The sum of all fixed costs forms the total fixed and variable costs of the enterprise (TVC, TFC).
To calculate the profitability threshold of an enterprise, the following two formulas are used analytically:
BEP 1 (Breakeven point) – profitability threshold in monetary terms;
TR (Total Revenue) – revenue from product sales;
TFC (Total Fixed Costs) – total fixed costs;
TVC (Total Variable Costs) – total variable costs.
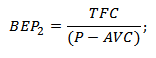
BEP 2 (Breakeven point) – profitability threshold expressed in physical equivalent (production volume);
P (Price) – unit price of goods sold;
AVC ( Average Variable Costs) – average variable costs per unit of goods.
 |
★ |
Calculation of the profitability threshold in Excel
To calculate the profitability threshold, it is necessary to calculate the enterprise’s fixed and variable costs and the volume of sales (sales) of goods. The figure below shows an example of the main parameters for calculating the profitability threshold.

Main parameters for assessing the profitability threshold of an enterprise
At the next stage, it is necessary to calculate how profit and costs will change based on the volume of sales of goods. Fixed costs are presented in column “B”; they will not change depending on the volume of production. Variable costs per unit will increase in proportion to production (column “C”). The formulas for calculating income and costs will be as follows:
Variable costs of the enterprise=$C$5*A10
Total enterprise costs=C9+B9
Income=A9*$C$6
Net profit=E9-C9-B9
The figure below shows this calculation. The profitability threshold in this example is achieved with a production volume of 5 units.

Estimating the enterprise profitability threshold in Excel
Let's assume another situation when sales volumes, variable and fixed costs are known and it is necessary to determine the profitability threshold. To do this, you can use the above analytical calculation formulas.
Profitability threshold in monetary terms=E26*B26/(E26-C26)
Profitability threshold in physical equivalent=B26/(C6-C5)

Calculation of profitability level using formulas in Excel
The result is similar to the “manual method” of determining the profitability threshold. It should be noted that in practice there are no absolutely constant or absolutely variable costs. All costs have the addition of “conditionally fixed” and “conditionally variable” costs. The fact is that with an increase in output, an “economy of scale” arises, which consists in reducing the cost (variable costs) of producing a unit of goods. Also with fixed costs, which can also change over time, for example, the rental rate for premises. As a result, when an enterprise moves from serial to mass production, an additional rate of profit and an additional margin of financial strength arise.
Determining the profitability threshold graphically
The second way to determine the profitability threshold is using a graph. To do this, we will use the data obtained above. As you can see, the profitability threshold corresponds to the point of intersection of income and total costs of the enterprise or the equality of net profit to zero. The critical level of profitability is achieved with a production volume of 5 pieces.

Graphic analysis of enterprise income and costs
Profitability threshold and margin of financial strength of the enterprise
Determining the minimum acceptable level of sales volume allows you to plan and create a margin of financial strength - this is the excess sales volume or the amount of net profit that allows the enterprise to operate and develop sustainably. For example, if the current production (sales) volume corresponds to 17 units, then the margin of financial strength will be equal to 240 rubles. The graph below shows the area of financial strength of the enterprise with a sales volume of 17 units.

Margin of financial strength of the enterprise
The margin of financial strength shows the distance of the enterprise from the break-even point; the greater the margin of safety, the more financially stable the enterprise.
|
★ (calculation of Sharpe, Sortino, Treynor, Kalmar, Modiglanca beta, VaR) + forecasting course movements |
Summary
The profitability threshold allows you to assess the critical level of production of an enterprise at which its profitability is zero. This analytical assessment is important for strategic management and the development of strategies for increasing sales and planning production volumes. Currently, sales volume is influenced by many different factors: seasonality of demand, sharp changes in the cost of raw materials, fuel, energy, production technologies of competitors, etc. all this forces the company to constantly look for new opportunities for development. One of the modern promising directions for increasing production volume is the development of innovation, as this creates additional competitive advantages in the sales market.